Greek Surfaces
This notebook visualizes option Greeks as surfaces over strike and time.
%matplotlib inline
import matplotlib.pyplot as plt
plt.rcParams["figure.dpi"] = 120

import numpy as np
from volkit import (
    price_euro_future,
    delta_euro_future,
    gamma_euro_future,
    theta_euro_future,
    vega_euro_future,
    rho_euro_future,
    dual_delta_euro_future,
    vanna_euro_future,
    vomma_euro_future,
    lambda_euro_future,
)

F = 100.0
r = 0.01
sigma = 0.2
cp = "call"

K = np.linspace(60, 140, 50)
T = np.linspace(0.01, 2.0, 50)
KK, TT = np.meshgrid(K, T)

Price = price_euro_future(F, KK, TT, r, sigma, cp)
Delta = delta_euro_future(F, KK, TT, r, sigma, cp)
Gamma = gamma_euro_future(F, KK, TT, r, sigma, cp)
Theta = theta_euro_future(F, KK, TT, r, sigma, cp)
Vega = vega_euro_future(F, KK, TT, r, sigma, cp)
Rho = rho_euro_future(F, KK, TT, r, sigma, cp)
DualDelta = dual_delta_euro_future(F, KK, TT, r, sigma, cp)
Vanna = vanna_euro_future(F, KK, TT, r, sigma, cp)
Vomma = vomma_euro_future(F, KK, TT, r, sigma, cp)
Lambda = lambda_euro_future(F, KK, TT, r, sigma, cp)
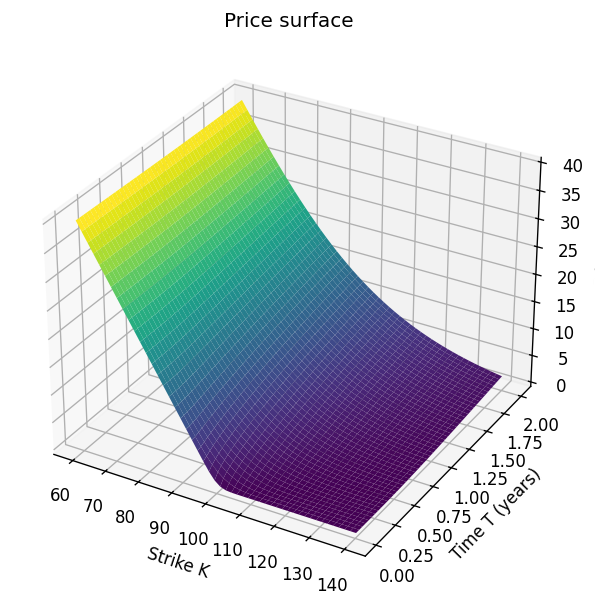
Price Surface
fig = plt.figure(figsize=(8, 6))
ax = fig.add_subplot(111, projection="3d")
ax.plot_surface(KK, TT, Price, cmap="viridis", edgecolor="none")
ax.set_xlabel("Strike K")
ax.set_ylabel("Time T (years)")
ax.set_zlabel("Price")
ax.set_title("Price surface")
plt.show()
plt.close(fig)
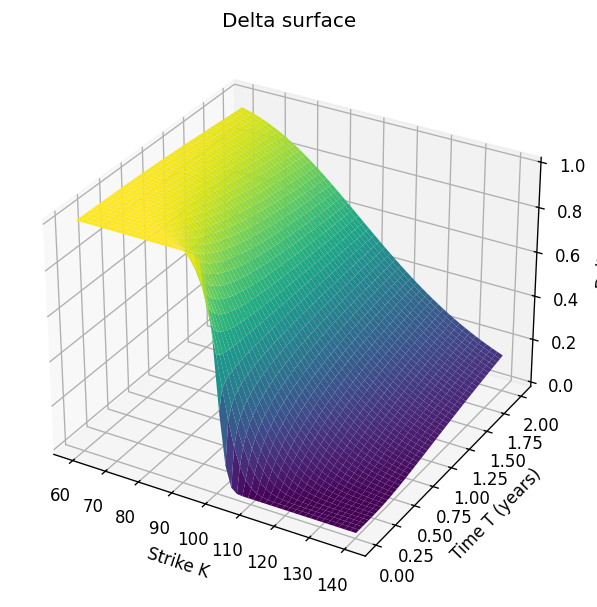
Delta Surface
fig = plt.figure(figsize=(8, 6))
ax = fig.add_subplot(111, projection="3d")
ax.plot_surface(KK, TT, Delta, cmap="viridis", edgecolor="none")
ax.set_xlabel("Strike K")
ax.set_ylabel("Time T (years)")
ax.set_zlabel("Delta")
ax.set_title("Delta surface")
plt.show()
plt.close(fig)
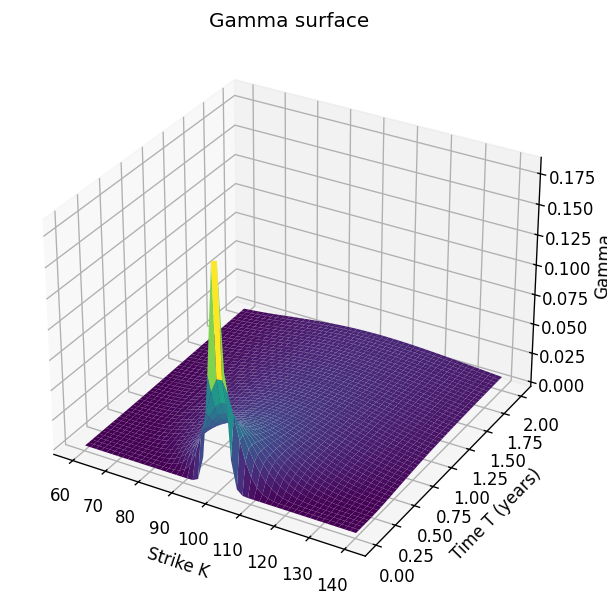
Gamma surface
fig = plt.figure(figsize=(8, 6))
ax = fig.add_subplot(111, projection="3d")
ax.plot_surface(KK, TT, Gamma, cmap="viridis", edgecolor="none")
ax.set_xlabel("Strike K")
ax.set_ylabel("Time T (years)")
ax.set_zlabel("Gamma")
ax.set_title("Gamma surface")
plt.show()
plt.close(fig)
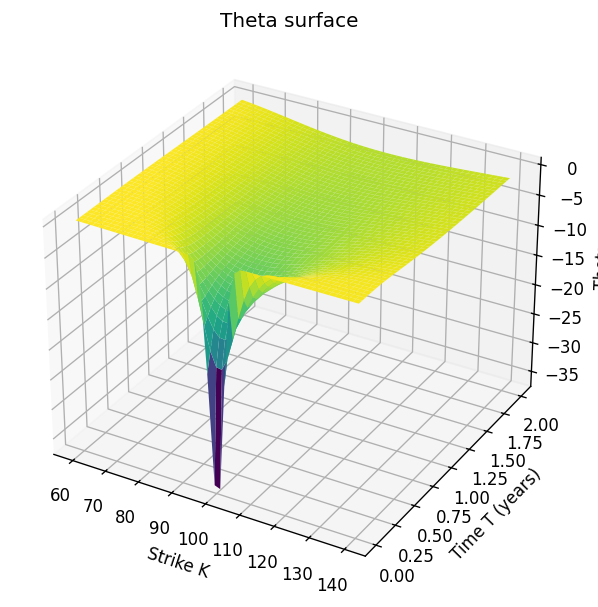
Theta surface
fig = plt.figure(figsize=(8, 6))
ax = fig.add_subplot(111, projection="3d")
ax.plot_surface(KK, TT, Theta, cmap="viridis", edgecolor="none")
ax.set_xlabel("Strike K")
ax.set_ylabel("Time T (years)")
ax.set_zlabel("Theta")
ax.set_title("Theta surface")
plt.show()
plt.close(fig)
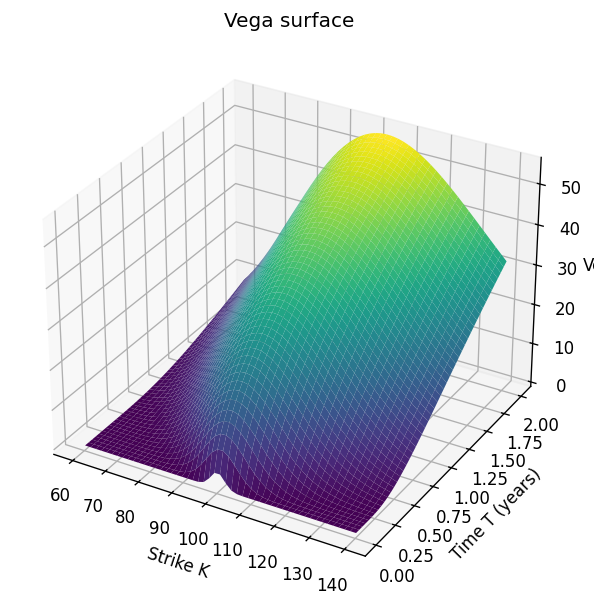
Vega surface
fig = plt.figure(figsize=(8, 6))
ax = fig.add_subplot(111, projection="3d")
ax.plot_surface(KK, TT, Vega, cmap="viridis", edgecolor="none")
ax.set_xlabel("Strike K")
ax.set_ylabel("Time T (years)")
ax.set_zlabel("Vega")
ax.set_title("Vega surface")
plt.show()
plt.close(fig)
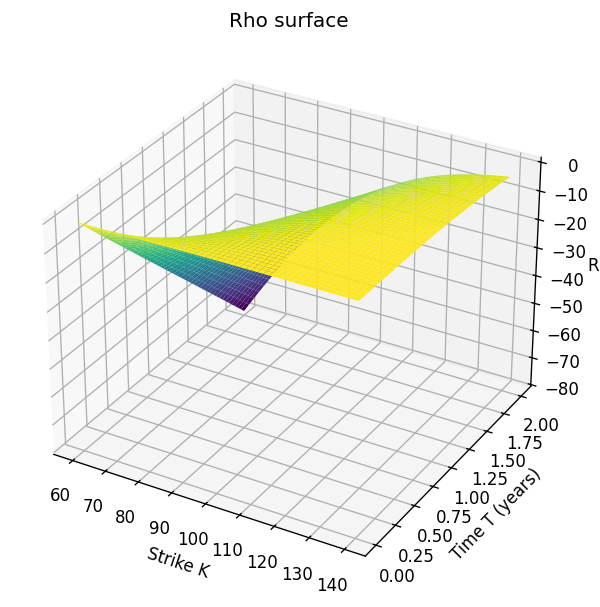
Rho surface
fig = plt.figure(figsize=(8, 6))
ax = fig.add_subplot(111, projection="3d")
ax.plot_surface(KK, TT, Rho, cmap="viridis", edgecolor="none")
ax.set_xlabel("Strike K")
ax.set_ylabel("Time T (years)")
ax.set_zlabel("Rho")
ax.set_title("Rho surface")
plt.show()
plt.close(fig)
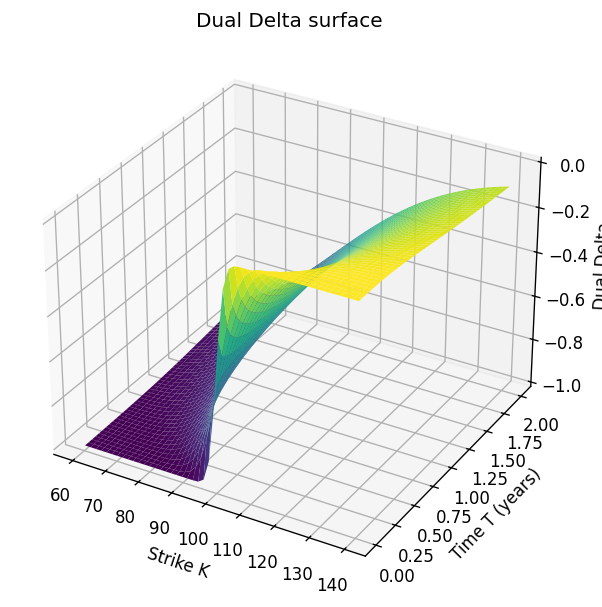
Dual Delta surface
fig = plt.figure(figsize=(8, 6))
ax = fig.add_subplot(111, projection="3d")
ax.plot_surface(KK, TT, DualDelta, cmap="viridis", edgecolor="none")
ax.set_xlabel("Strike K")
ax.set_ylabel("Time T (years)")
ax.set_zlabel("Dual Delta")
ax.set_title("Dual Delta surface")
plt.show()
plt.close(fig)
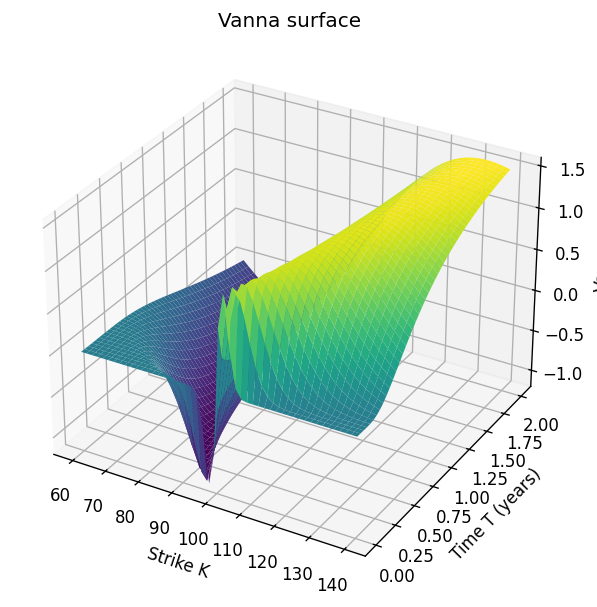
Vanna surface
fig = plt.figure(figsize=(8, 6))
ax = fig.add_subplot(111, projection="3d")
ax.plot_surface(KK, TT, Vanna, cmap="viridis", edgecolor="none")
ax.set_xlabel("Strike K")
ax.set_ylabel("Time T (years)")
ax.set_zlabel("Vanna")
ax.set_title("Vanna surface")
plt.show()
plt.close(fig)
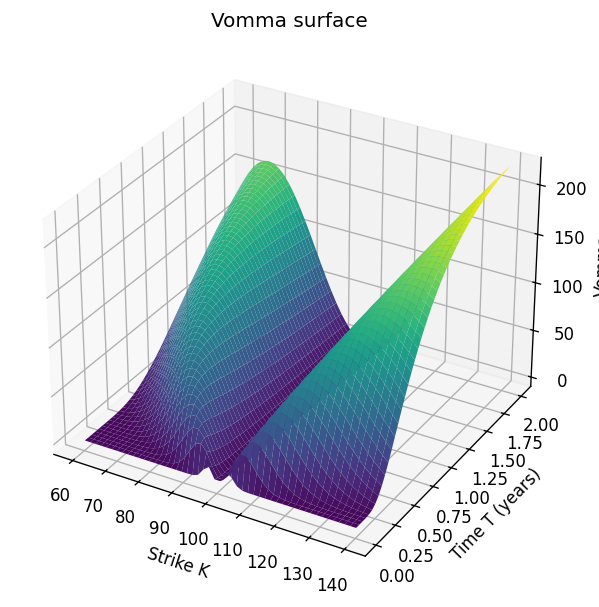
Vomma surface
fig = plt.figure(figsize=(8, 6))
ax = fig.add_subplot(111, projection="3d")
ax.plot_surface(KK, TT, Vomma, cmap="viridis", edgecolor="none")
ax.set_xlabel("Strike K")
ax.set_ylabel("Time T (years)")
ax.set_zlabel("Vomma")
ax.set_title("Vomma surface")
plt.show()
plt.close(fig)
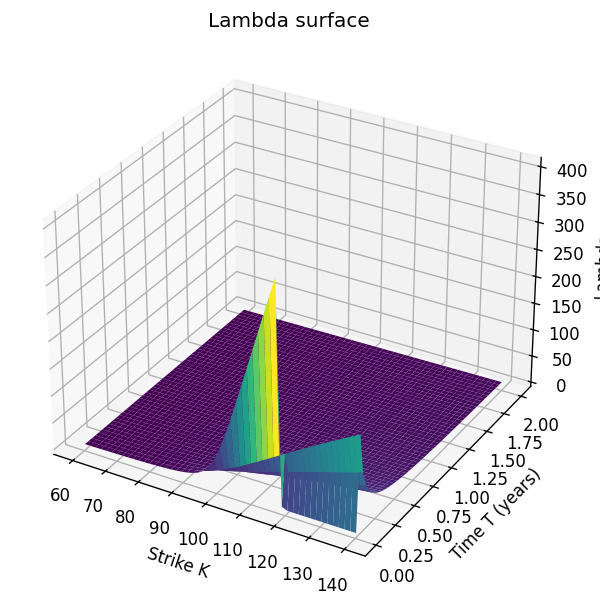
Lambda surface
fig = plt.figure(figsize=(8, 6))
ax = fig.add_subplot(111, projection="3d")
ax.plot_surface(KK, TT, Lambda, cmap="viridis", edgecolor="none")
ax.set_xlabel("Strike K")
ax.set_ylabel("Time T (years)")
ax.set_zlabel("Lambda")
ax.set_title("Lambda surface")
plt.show()
plt.close(fig)