Implied Future & Discount From Option Quotes
This notebook computes the implied underlying future bid/ask from option quotes of a single expiry.
Computes an implied future quote \([F_{\text{bid}}, F_{\text{ask}}]\) and a discount range \([D_{\min}, D_{\max}]\) that are jointly consistent with the quoted calls & puts.
Identifies and excludes the fewest possible strikes whose quotes prevent any consistent solution (likely stale/misquoted lines).
Visualizes per-strike implied future intervals and the final \([F_{\text{bid}}, F_{\text{ask}}]\).
%matplotlib inline
import matplotlib.pyplot as plt
plt.rcParams["figure.dpi"] = 120

from volkit import estimate_future_from_option_quotes
from volkit.datasets import spxw
Read a set op example option quotes. Weekly S&P options with 7 days to expiry. Use only quotes that have been trades at least once (min_vol=1)
df = spxw(min_volume=1, D=7)
res, valid_mask = estimate_future_from_option_quotes(
   df['K'],
   df['C_bid'],
   df['C_ask'],
   df['P_bid'],
   df['P_ask'],
   plot=True
)

res
| F | 2918.900000 |
|---|---|
| F_bid | 2918.600000 |
| F_ask | 2919.200000 |
| D | 0.999083 |
| D_min | 0.99066667 |
| D_max | 1.00750000 |
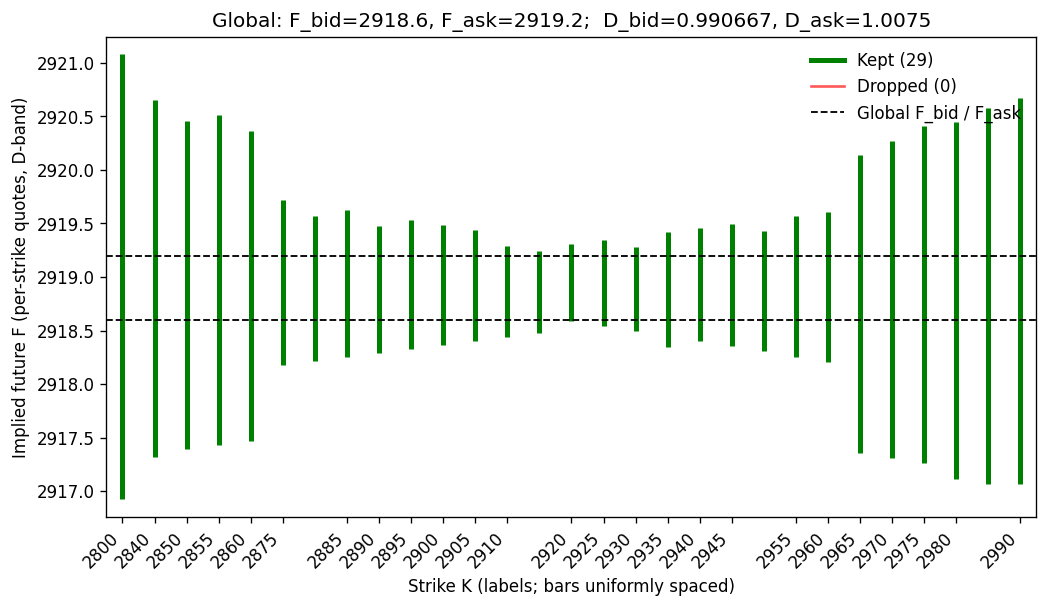
The plot
We plot, for each strike \(K_i\), a vertical bar from \(F_{\text{bid},i}\) to \(F_{\text{ask},i}\) (computed at a representative discount \(D^* = (D_{\min}+D_{\max})/2\):
Green bars: strikes that were kept (they all overlap with the final band).
Red bars: strikes that were excluded (their intervals don’t overlap the consensus). These are typically stale quotes (e.g., recorded when the underlying was briefly elsewhere) or fat-fingered lines, and they create arbitrage when combined with the rest of the book.
Two dashed black horizontal lines mark the final \(\big[F_{\text{bid}}, F_{\text{ask}}\big]\).
By construction, all green bars intersect this band.